

Chart
A bar, stacked-bar, line, area, pie, donut or sparkline chart with axes, legend and tooltip.
Group: Data · Kind: native
Preview
Section titled “Preview”example
| Runs | |
|---|---|
| Mon | 3 |
| Tue | 5 |
kind · stackedBar
| Runs | |
|---|---|
| Mon | 3 |
| Tue | 5 |
kind · line
| Runs | |
|---|---|
| Mon | 3 |
| Tue | 5 |
kind · area
| Runs | |
|---|---|
| Mon | 3 |
| Tue | 5 |
kind · pie
MonTue
| Runs | |
|---|---|
| Mon | 3 |
| Tue | 5 |
kind · donut
MonTue
| Runs | |
|---|---|
| Mon | 3 |
| Tue | 5 |
kind · sparkline
Platforms
Section titled “Platforms”The same specimen painted by React, SwiftUI, Compose and gpui.
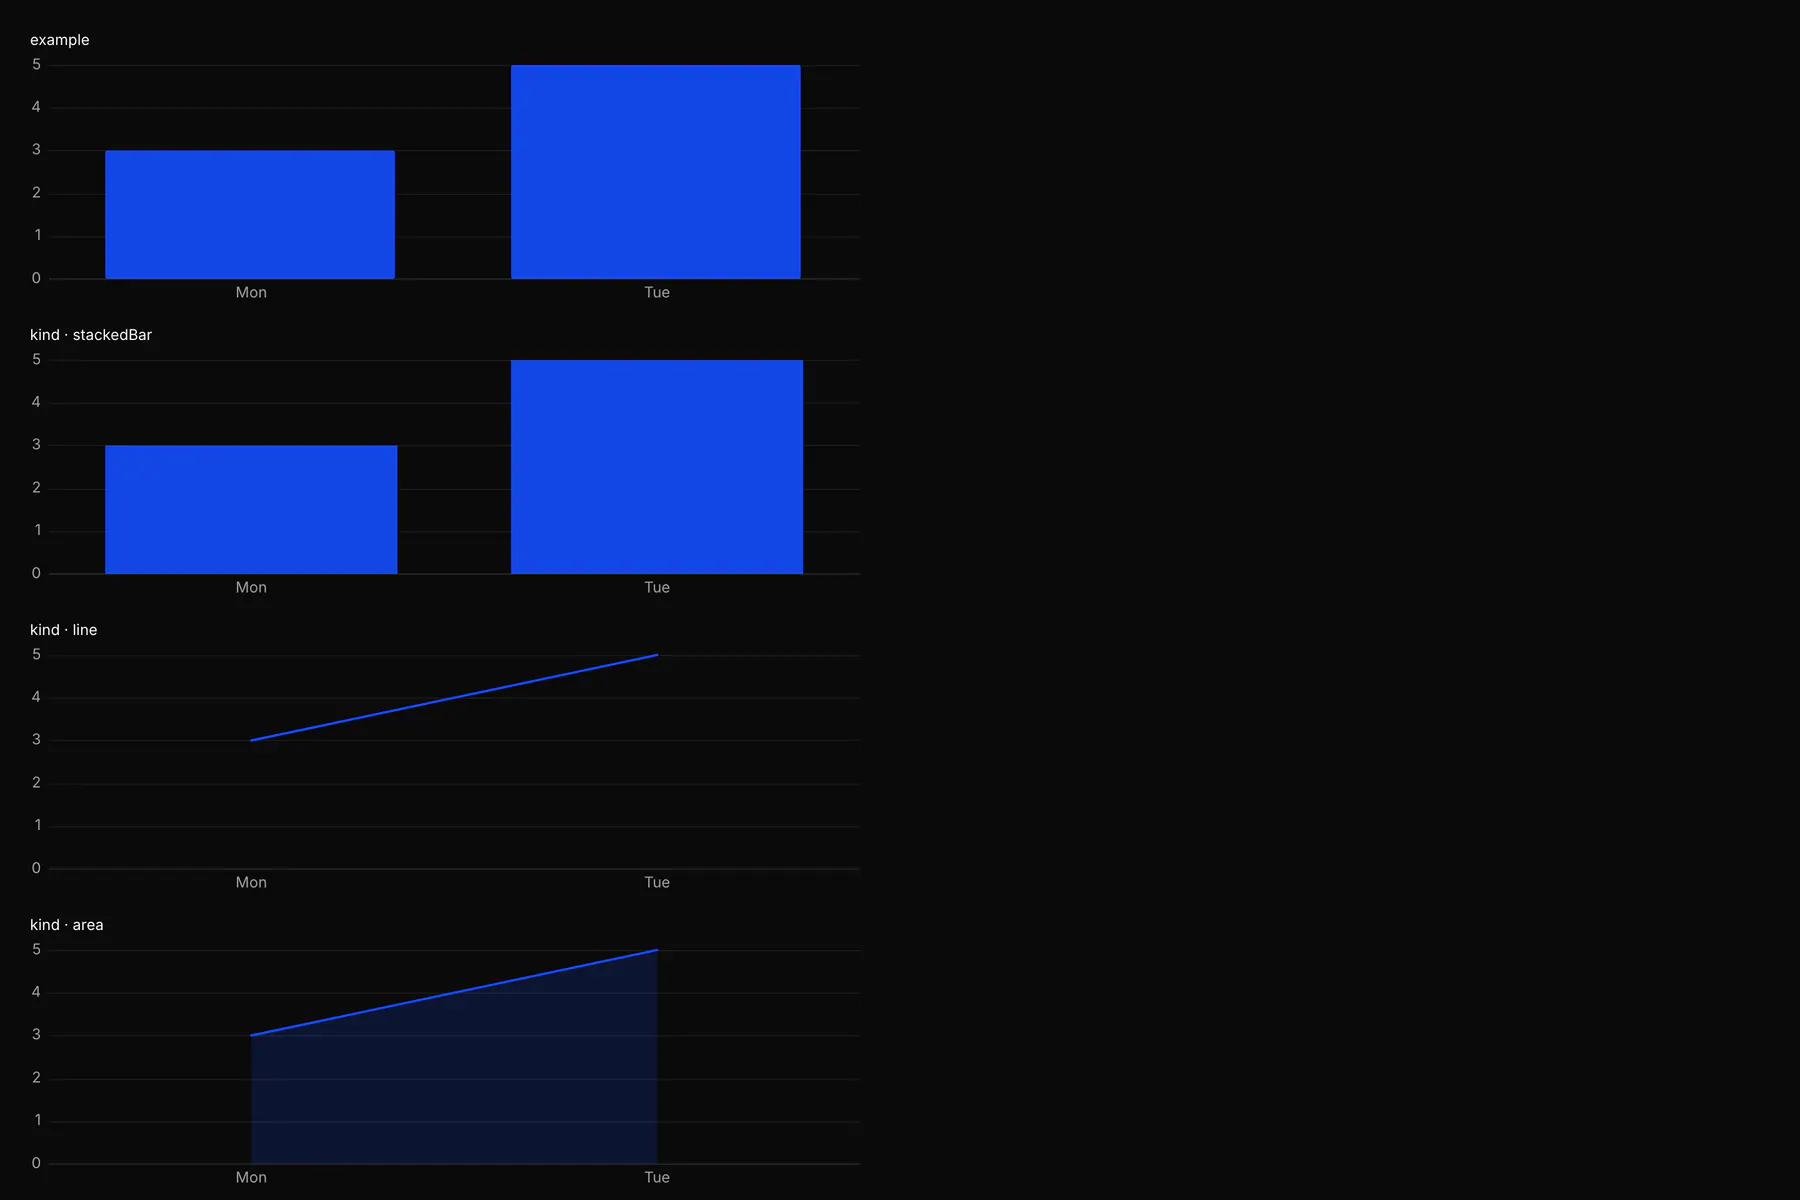
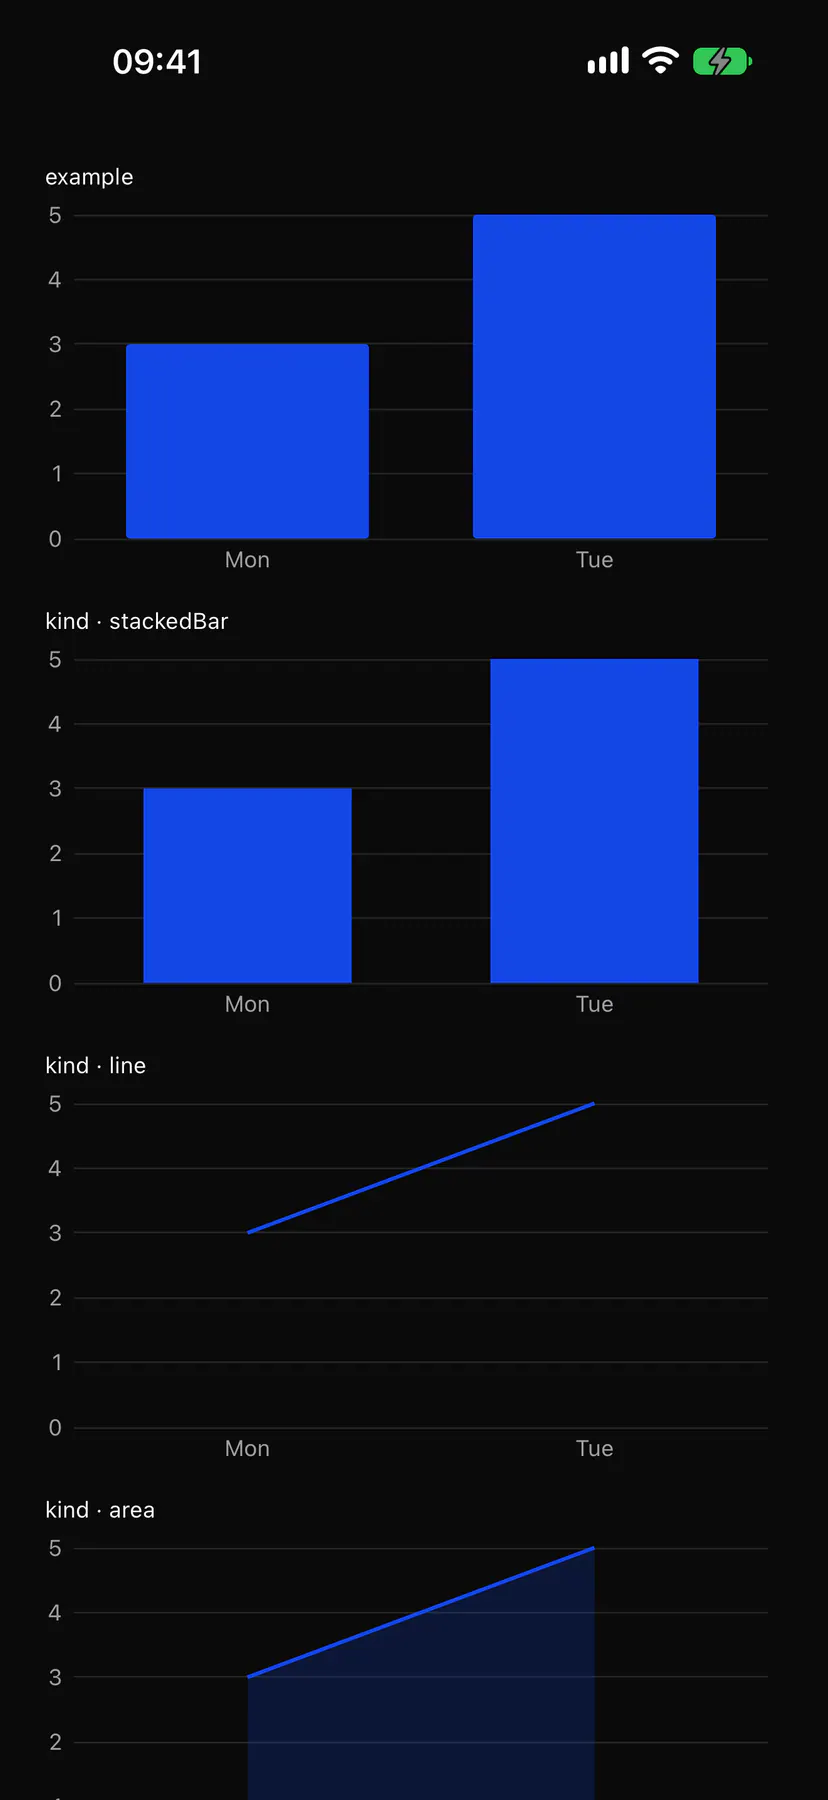
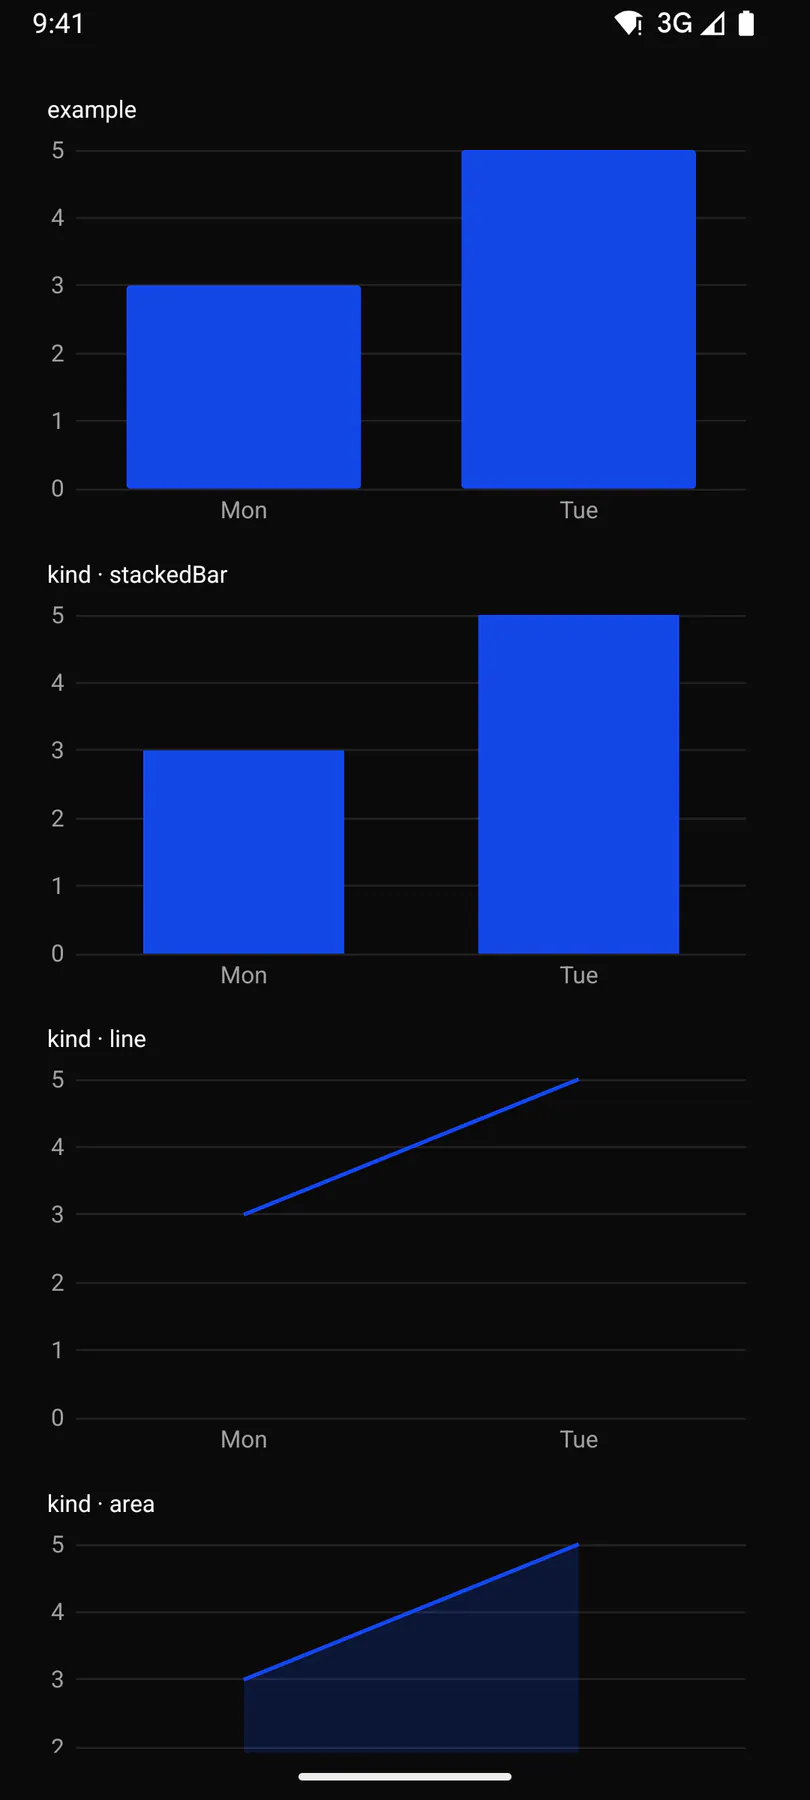
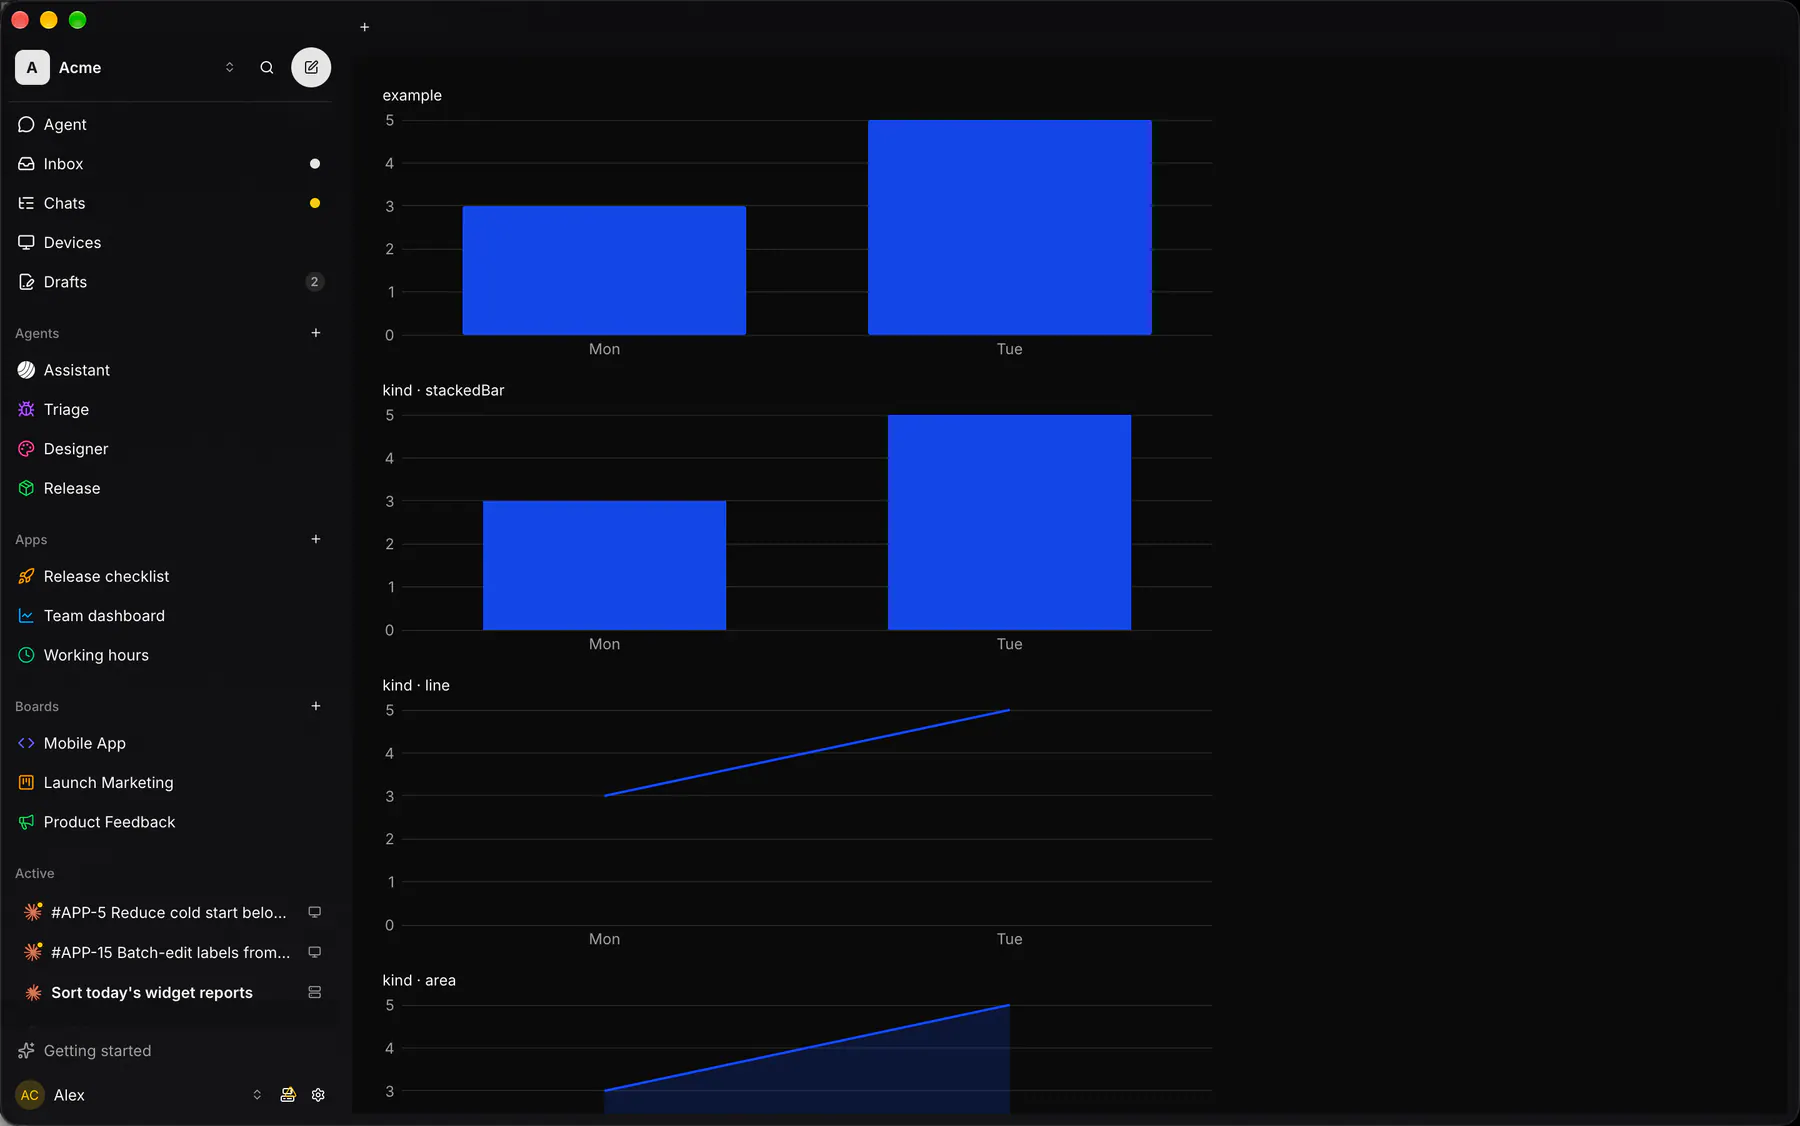
Variants
Section titled “Variants”showValues
| Runs | |
|---|---|
| Mon | 3 |
| Tue | 5 |
| Prop | Type | Required | Bindable | Description |
|---|---|---|---|---|
kind |
bar | stackedBar | line | area | pie | donut | sparkline |
yes | – | The chart form. |
categories |
[string] |
– | yes | The x-axis labels, or the pie slices; omit for a sparkline. |
series |
[series] |
yes | yes | One per line, bar group or pie ring. |
title |
string |
– | – | A title above the chart. |
height |
number |
– | – | The whole chart’s height in px (title, legend, axes inside); the width is the box’s. Default 200. |
xLabel |
string |
– | – | A caption under the x axis. |
yLabel |
string |
– | – | A caption beside the y axis. |
min |
number |
– | – | The y-axis floor; defaults to 0. |
max |
number |
– | – | The y-axis ceiling; defaults to the largest value. |
showAxes |
boolean |
– | – | Draws the axes with tick labels. Default true. |
showGrid |
boolean |
– | – | Draws horizontal grid lines at the ticks. Default true. |
showLegend |
boolean |
– | – | Draws the legend (2+ series or slices). Default true. |
showValues |
boolean |
– | – | Writes each value on its bar, point or slice. Default false. |
Events
Section titled “Events”None.
None.
Children
Section titled “Children”none
A2UI basic mapping
Section titled “A2UI basic mapping”No basic catalog component maps here.
Built from
Section titled “Built from”A native component: every renderer paints it directly.
Accessibility
Section titled “Accessibility”Role: img
img with a generated summary (kind, series, ranges); a data table fallback for screen readers. The painter names it with chartSummary (series, min, max) and offers a data table fallback.
| Keys | Action |
|---|---|
ArrowLeft ArrowRight while focused |
move the tooltip between categories |
Theming
Section titled “Theming”Recipe parts: Chart/root Chart/title Chart/axis Chart/grid Chart/legend Chart/tooltip Chart/valueLabel
Keyed by: kind :hover :pressed :focus :disabled :checked :open :selected :invalid :dragover